
Data Mining: Three Riders, Similar Lap Times, Different Approaches

Three very similar lap times. Three very different ways of getting there.


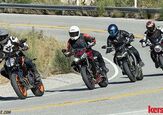
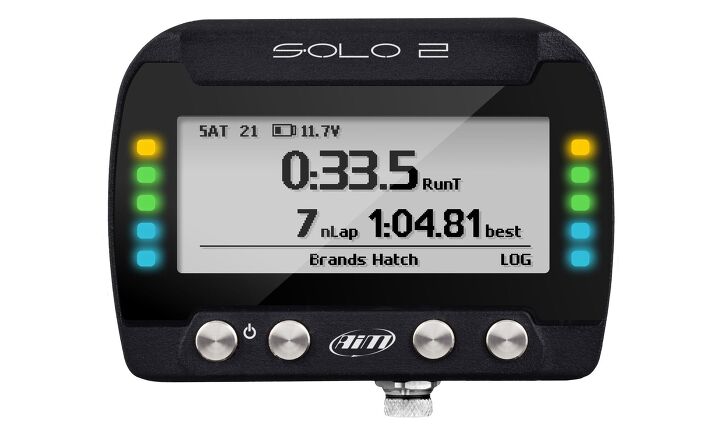
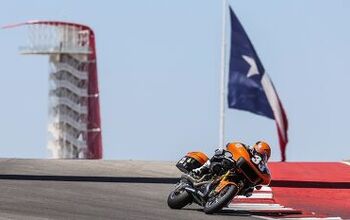
For the track portion of our 2021 Heavyweight Naked Bike Shootout, we tried a little experiment. As if there wasn’t enough going on during our track test with simply riding the bikes (and also trying on a bunch of different helmets), we also fitted a few AiM Solo2 lap timers/data loggers onto the bikes and let the boys rip. The Solo2 is a cool device because, beyond just recording lap times, the internal gyroscopes, accelerometers, and GPS can record speed, acceleration, deceleration, lean angles, and so much more. The goal here was to have a little fun and try our hands at collecting data. By no means am I an expert at reading the data (far from it), but I had assistance from a few friends to help make sense of it all.
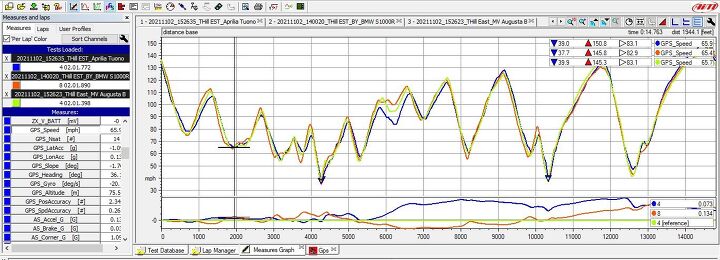
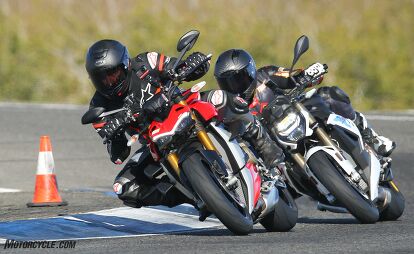
I really wasn’t sure what to look for, honestly. Initially, the idea was to see if the data could back up our tester’s seat-of-the-pants feelings – or completely make liars out of us. What ended up happening was a little different. As it turned out, three testers – Mark Miller, Ken Hill, and Yours Truly – all recorded a 2:01.xx lap time, the fastest recorded lap times of the test (though not necessarily the fastest any of the seven bikes were capable of), all three separated by 0.5s. All three were on different bikes, too. Ken was the quickest on the MV Agusta (surprisingly), I was next on the Aprilia, 0.4s behind, and Mark did his time on the BMW, just 0.1s behind me!
*An important note* With seven bikes to ride at a public trackday, we weren’t able to get clean, uninterrupted laps on all seven bikes. Hence why we couldn’t use lap times to rank the bikes in our finishing order. Nonetheless, we can still examine how these three riders, on three different bikes, got to the same place in three different ways.
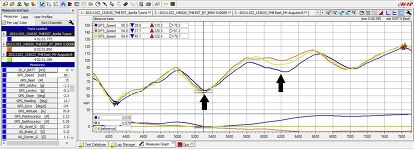
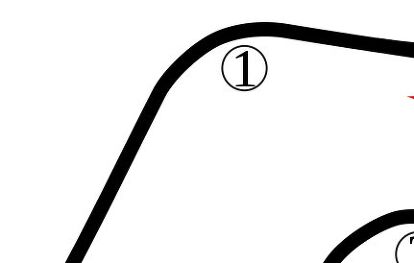
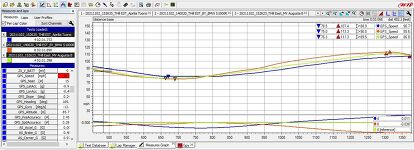
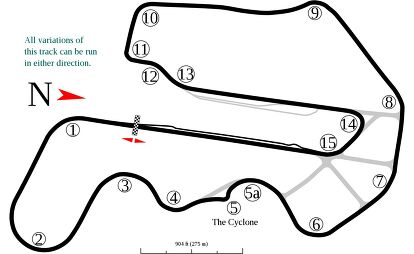
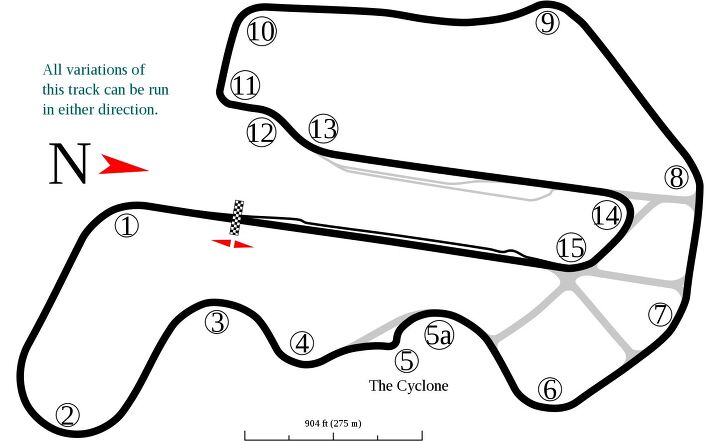
There are a dizzying amount of channels we can look at, but to keep things relatively simple, we’re primarily going to look at the recorded speed traces for each bike and rider through the 15 turns of Thunderhill’s East track and try to make sense of them. An interactive, 360º Google Street View image is included for each turn so you can follow along (ignore the cars). Click the image to move forward or backward, and click the compass icon to the right of the image to rotate the point of view a full 360 degrees.
Turn 1
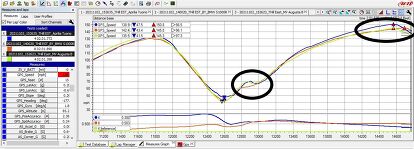
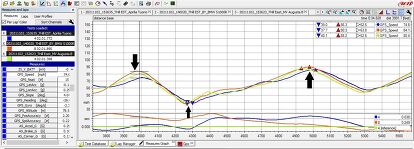
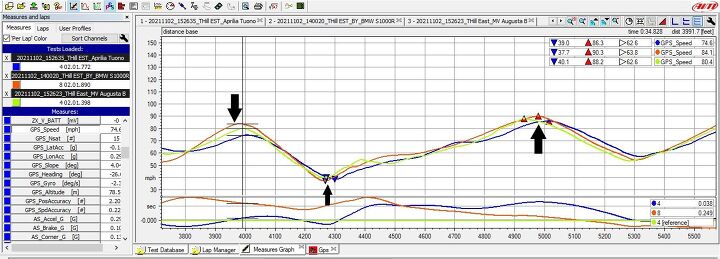
The approach for Turn 1 comes at the end of a long start/finish straight, where speeds can reach in excess of 150-plus mph. At the apex of Turn 1, Ken and Mark have similar slow points (as in the slowest point of the corner for the respective rider). Ken is at 76.4 mph, Mark is at 75.2 mph, and I’m at 78.5 mph. This sounds great for me initially, but I stay at 78 mph longer without getting any faster. Meanwhile, Ken and Mark are at their slow points for a moment before accelerating, quickly going faster than me by corner exit.
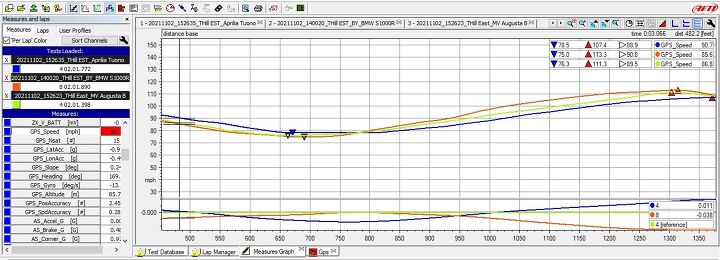
In the distance between T1 and T2, Mark, on the BMW, goes fastest. At his fastest point, he’s reached 113.1 mph, Ken’s at 111.1 mph, and I’m doing 105.7 mph but still accelerating. By the time Mark and Ken have already started their deceleration for T2, I’m still accelerating slightly. I reach my highest speed of 107.1 mph a tick later before starting my braking.
Turn 2

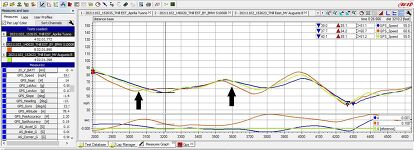
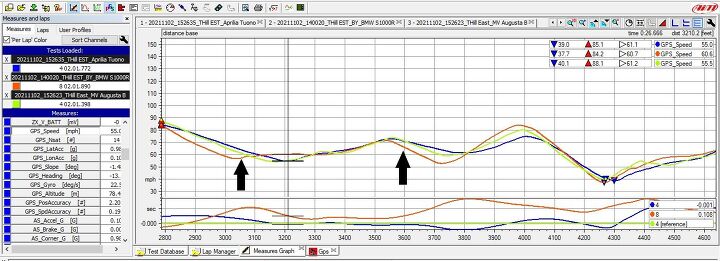
Turn 2 is a long, nearly 180-degree left. Mark slows early and considerably for T2 (orange line just after left arrow), Ken slows next (green line), while he and I have nearly identical deceleration rates while carrying more speed. It’s possible Mark may have encountered traffic, or his lack of track knowledge (this was his first time at the track, though this was not his first lap obviously) may have led to his rapid deceleration. At the slowest point, all three are virtually identical at 64-66 mph (middle arrow). The data shows that by this point in the lap Ken is already 0.126s ahead of Mark and 0.077s in front of me. Mark accelerates sooner on the exit of T2 but doesn’t hold consistent throttle, based on the rise and fall of his speed trace. Ken and I accelerate later, but consistently. Nonetheless, Mark still finds a way to reach a higher peak speed before slowing for Turn 3 (right arrow), and he gets there before the rest of us. Mark’s sharp acceleration traces would indicate he’s not shy with his throttle hand.
Turn 3
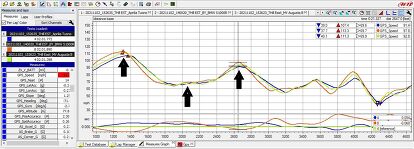
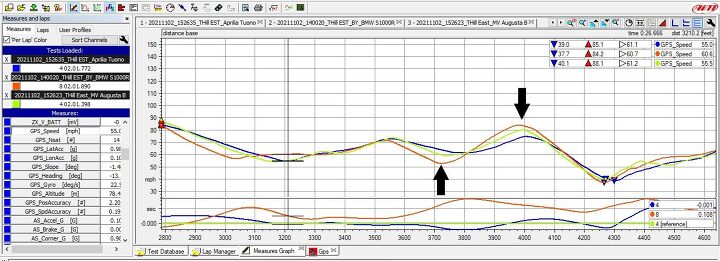
You may not be able to tell in the Street View image above, but the entry to Turn 3 is tricky, as it’s an off-camber right turn. You need to trail the brakes into it, but the off-camber nature of the pavement tests the limits of the front tire – and your bravery. As we saw from the T2 speed trace, Mark reaches his fastest point soonest, reaching 97.8 mph. But he more clearly goes from acceleration to decel, as shown by the sharp V shape as the speed trace goes up then down – indicating he’s more comfortable applying more brake pressure. Mark is trailbraking more rapidly than I am. I reach my fastest point approximately the same spot, 91.4 mph, but have a more gradual decline in speed, shown by my speed trace looking more like a U – meaning I’m tip-toeing, afraid to tuck the front on the brakes.
Ken stays on the gas a few feet longer, but his max speed is 95.2 mph. Mark then finds his slowest part of T3 much sooner than myself or Ken (left arrow). Mark’s slow point is 58.1 mph, whereas at the same point I’m at 67.8 mph and Ken is doing 64.9 mph. A few feet later, Ken and I reach our slowest speeds (aka apexes), but Ken gets there faster than I do. By now, Mark has already started accelerating, reaching 60 mph while Ken is going 54.6 mph and I’m 57.4 mph.
Turn 4
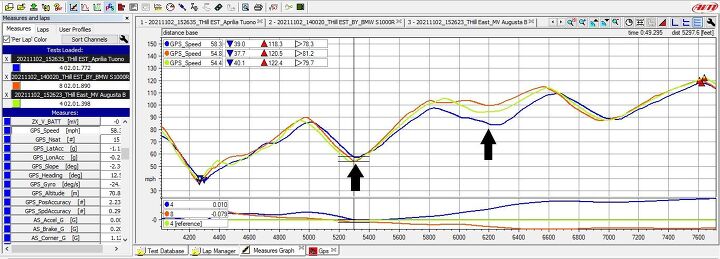
Turn 4 is a quick left kink before driving up a steep incline. All three of us are similar at the fastest point – 71-73 mph. But Mark brakes significantly more than me and Ken (left arrow below), reaching his slow point of 53.5 mph while I’m doing 63.4 mph and Ken is at 59.3 mph. At this point, I’m 0.059s faster than Ken, Mark is 0.271s slower. Crucially, Mark and Ken reach their slow point at roughly the same time while I’m still decelerating. By the time I reach my slowest point a few feet later we’re all about 62 mph and driving up the hill to the Cyclone, also known as Turn 5. I’m still 0.078s faster, Mark 0.327s slower.
Mark’s speed trace continually shows a sharp rise in acceleration after his slowest points, which tells us he’s not shy about twisting the throttle. But it also shows us he’s become comfortable with traction control having his back, even if he doesn’t realize it. This sharp V from deceleration to acceleration shows up again as Mark gets an incredible drive up the hill on the BMW (orange line), reaching 84.3 mph at his fastest point. Ken’s drive on the MV Agusta is nearly as sharp, reaching 80.1 mph before they both have a more clearly defined moment of decel (right arrow). My acceleration on the Aprilia is noticeably weaker and shorter up the hill, though I stay on the gas just a tiny bit longer. But my 75 mph is nothing compared to those two. Maybe I was a gear high? Nonetheless, all three of us very clearly start slowing for the top of the Cyclone at about the same point.
Turn 5
Much like Laguna Seca has the famous Corkscrew, Thunderhill has the (much less) famous Cyclone – a sharp left you enter blindly after climbing a steep incline, before dropping down a story or two through a slightly open radius right. Sound familiar? (Be sure to click the arrows to move the map forward and follow the cars up and over the Cyclone). Immediately coming down the hill (after middle arrow), Ken drives early before letting off (green line). Mark (orange line) is not far behind. I’m slowest accelerating down the hill (blue line), but I’m gradual and consistent. Mark gets on the gas hard, but we all eventually meet up at a slower part of the right turn (middle point between middle and right arrows).
Turn 6
One of Thunderhill’s fastest sections is a series of open left turns. Turn 6 is the first of them, and though its entry coming from 5 is on the slower side (you need to brake slightly to get the bike pointed in the right direction), you want to get on the throttle as quickly as possible for the Turn 7 kink and the slight blip through Turn 8. This series of left turns will make or break a lap.
Ken reaches his peak first before trailing off for the first left. At this point, Ken and Mark are similar at 88 mph and I’m at 82.3 mph. While Ken has started his deceleration, Mark keeps accelerating a little longer before sharply decelerating at 90.1 mph (Ken’s already slowing at 86.7 mph and I’m still accelerating a little bit to 86.2 mph). Overall at this point, I’m now 0.264s slower on the lap and Mark is 0.056 slower. Ken reaches his slowest point first, followed by Mark, then me (left arrow below). This marks our respective apexes for T6 (roughly where the white curbing starts in the Street View image above).
By now another interesting trend starts to emerge: Ken is generally starting his deceleration before Mark and myself, applying the brakes lighter but for a longer period of time. The reason is because the MV Agusta he’s piloting has the most aggressive ABS intervention of the bikes in our test, and braking at a more natural point would cause nearly immediate triggering. On previous laps, I saw Ken run wide at a few points because he couldn’t get the bike slowed in time, ABS intervention being the annoying culprit. I later experienced it myself when I rode the bike. So, the solution was to brake earlier and lighter, avoid ABS cutoff, and let the MV’s chassis carry roll speed through the corner.
Exiting Turn 6, where it’s critical to accelerate as soon as possible, once again Mark is able to exploit the power earlier and harder as we head towards the fastest section of the track. You’re carrying some lean angle here, too, so considering how sharp Mark’s acceleration curve looks, which indicates Mark is on the throttle hard and early, we have to assume traction control is stepping in to keep Mark from going into orbit. Ken is giving chase, only a couple mph off, and I’m starting to trail behind.
Turn 7
You’re into or approaching the triple digits as you approach Turn 7, an open and fast left kink, shown above. At the fastest point before tipping in, I top out at 97.8 mph, but Mark reaches 103.8 mpg. Ken’s at 101.4 mph at this point but still accelerating. Ken rolls off a few feet later, at 105.7 mph, and brakes slightly.
Mark is a rockstar through T7, carrying massive roll speed (104.1 mph). Both Ken (97.7 mph) and I (89.7 mph) are actively slowing, before Mark briefly taps the brakes, presumably to get the bike pointed where he wants. At the slowest point of T7 I’m far behind – 0.462s down on the lap and putting along at a comparatively slow 85 mph. Mark is actually faster than Ken by 0.262 at this point in the lap, carrying a massive 102.6 mph. Ken’s at 96.5 mph. At my slowest point in the corner, I’m 11 mph slower than Ken and 18 mph slower compared to Mark. There’s a bit of an anomaly here, as I’m not sure why I scrubbed off so much speed (blue line and the right arrow in the T6 graph). I don’t seem to be doing it on other laps, so my best guess is traffic or a botched shift.
Turn 8
The approach to the slight left of Turn 8 is tricky because the entry to it is fast, and just when you think you can blast through there without much effort, you realize the turn actually tightens just a little. You need to tap the brakes a smidge to point the bike in the right direction before blasting up the incline towards Turn 9.
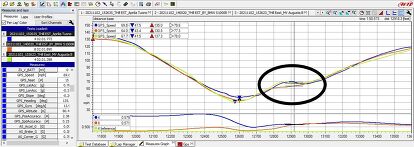
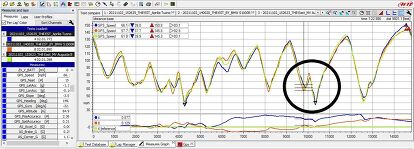
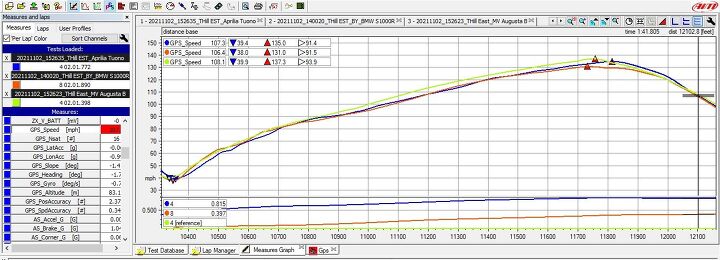
Once again Mark has the most entry speed into the corner, reaching 115.4 mph, and is 0.330s faster than Ken at this point in the lap. Ken reaches his fastest point at nearly the exact same spot doing 113.4 mph, and I’m in the back at 106.8 mph but still accelerating (highlighted in the circle below). I’m 0.623s slower on the lap so far.
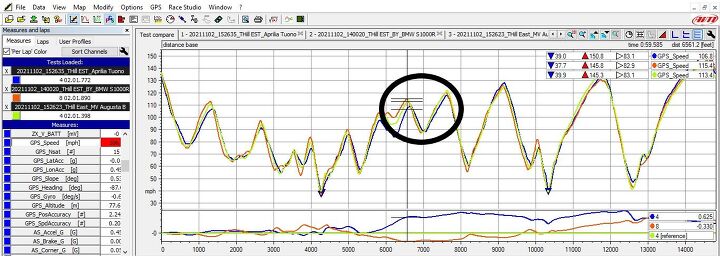
I begin my braking a fraction later than they do, reaching a terminal speed of 110.1 mph. But at this point, all three of us have similar deceleration rates. Just as he’s quick on the throttle, Miller also reaches his slowest point of the corner sooner than anyone else. By the apex, Mark’s at 87.7 mph. A few feet later Ken slows to 88.0 mph, and a few feet later still I finally reach my slow point of 88.6 mph. But while I’m slowing down, Mark and Ken are already speeding up, driving out of the corner and up the hill with similar acceleration curves. I’m playing catch-up, trailing behind them by just a few miles per hour until we slow for Turn 9 (we all choose very similar braking marks, as shown in the peak of the curve in the right side of the circle), Ken reaches 121.8 mph, Mark 120.5 mph, and I reach 118.3 mph.
Turn 9
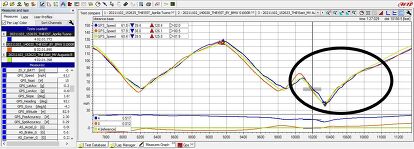
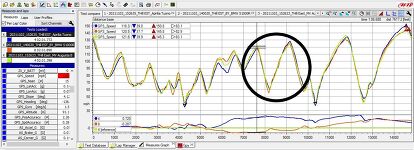
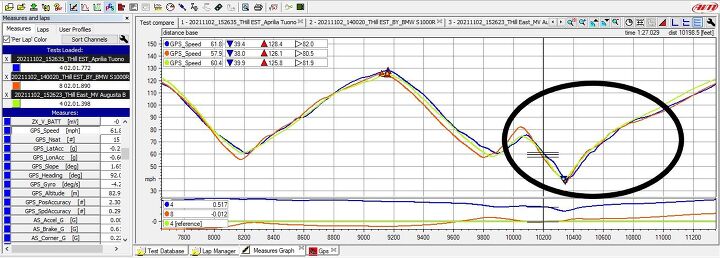
You’re climbing an incline exiting Turn 8, turning left into 9 with the apex of the turn still slightly uphill. The summit of Turn 9 takes a slight veer to the left and is followed by a sharp drop. This means you’re approaching the summit without a view of what’s to come – all while managing a wheelie and trying not to run off the road to the right as the pavement shifts to the left. Once again, Mark’s braking from T8 to T9 is very clearly defined, as his acceleration line turns into a decel line very sharply. He also decelerates more than Ken and myself, reaching his slowest point/apex at 56.1 mph (low point of the orange line in the circle below). Ken’s doing 61.7 mph and has basically reached his slowest point, too. Meanwhile, I’m 63.6 mph and don’t reach my slowest speed of 61.1 mph until a few feet later – while Mark and Ken are well into their acceleration zones. Overall, Mark is still 0.086s faster on the lap and I’m 0.777s slower. Miller once again accelerates like a banshee coming up and over the hill and back down.
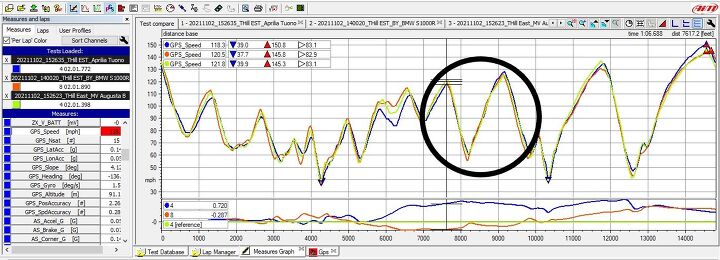
My moment of glory comes at the end of the chute between T9 and T10, as I reach the fastest speed before the three of us start braking (blue line in the second peak in the circle above). I hit 128.4 mph, Ken hits 125.6 mph, and Mark reaches 124.1 mph before we brake. Ken yet again slowed early to avoid triggering the MV’s ABS.
Turn 10
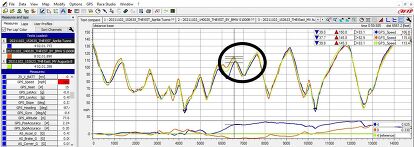
A slow left turn approached at a high rate of speed, Turn 10 is a little bigger than 90 degrees and tests a rider’s trail braking confidence. As we look inside the circle in the graph below, Mark again brakes the soonest, scrubs the most speed, and reaches his slowest point first, reaching 57.7 mph. Ken’s at 62.1 mph at this point and still slowing, reaching his slowest point (58.6 mph) a few feet later. Strangely, this is one of the few times Ken doesn’t brake early to avoid ABS kicking in. And yet again, I’m still slowing down, ultimately reaching my slow point of 61.0 mph a few feet later than Ken. However, by this point Miller is well into his acceleration phase and is at 62.7 mph at roughly the same point in the corner.

This is the point in the overall lap time where Mark gives up the lead to Ken and never gets it back. The early braking and lowest apex speed combined with Ken braking later and reaching a faster apex speed was all it took for Ken to take the overall advantage. As noted above, Mark’s early brake point does have an advantage, as he’s able to accelerate sooner than the rest of us, though this time it doesn’t appear as Miller was as aggressive on the throttle as in previous corners. Still, at the fastest point in the short chute between T10 and T11, Mark’s reached an impressive 82.5 mph, as indicated by the orange peak in the circle above. Ken and I accelerate more sharply and brake slightly later, but can only muster 75 mph. Mark is again impressive with how defined and deliberate his braking is. It’s a trend he repeats on all the bikes, not just the BMW.
Turn 11/12/13
Turn 11 is essentially a 90-degree left that leads to a quick right/left kink that are Turns 12 and 13. The Street View image above starts at approximately the apex of T11, looking down towards the right at T12 (where the cars are) and the left of T13 following it. The left for T11 doesn’t sound like much, especially since it’s one of the slowest corners on the track, but it’s very important to get it right as the trajectory you take leads to the long and fast back straight. All three of us reach our slowest point for T11 at roughly the same spot (lowest point within the circle below), doing around 40 mph. Exiting Turn 11 is tricky, as the shallow curbing directs you to keep turning left before flicking right for T12, but the curbing is so shallow – and there’s enough pavement (albeit rough pavement) beyond the curbing – that many people straight-line T12, and flick the bike left for T13 instead. Imagine the red car above pointed about 20º to the right instead of following the two cars in front.
Ken and Mark get great drives exiting T11. We presume that because the MV lacks low-end torque, Ken is forced to open the throttle quickly and as far as he can to tap into the top-end horsepower. From there, Hill’s speed trace stays fairly linear through T12 and T13 (green line in the graph below). To be fair, Mark’s drive (orange line) out of T11 is a very close match to Ken, but his speed lifts very slightly through T12 and T13. My speed exiting T11 and bee-lining past T12 is about five miles per hour behind Mark and Ken, but I chalk it up to a mental block I have, not wanting to be full-stick while leaning the bike left for T13. Despite traction control having my back, I fear flicking the bike quickly on its side to the left while full throttle will bring up the revs quickly and cause the rear tire to spin – I’ve seen it happen before. The result wasn’t pretty.
After T13, my acceleration curve picks up sharply. I’m clearly at full throttle. But it’s too little, too late, as Ken is already rocketing down the back straight, reaching a max speed of 137.2 mph before the bridge preceding Turn 14. Interestingly, Mark’s initial acceleration curve exiting T13 is fairly close to Ken’s, but as the two make a run down the back straight, Ken is simply out-pacing him. This could be a testament to the MV’s top-end power compared to the BMW which seemed to run out of steam at high rpm. In fact, my pace on the Tuono was nearly identical to Miller’s on the S1000R, but was also no match for Ken and the MV. Once again, Mark starts his deceleration earlier than Ken or myself, as denoted by the first of the orange triangles to the right of the graph. Ken follows shortly after, at a point I thought was a little early, but this was also the spot on a previous lap I saw Ken get entangled with the ABS and run wide. I brake the latest, reaching 135 mph before getting on the brakes.
Turn 14
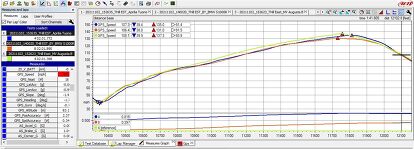
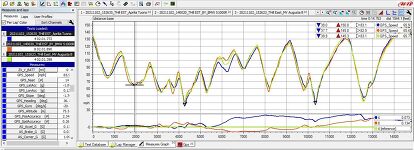
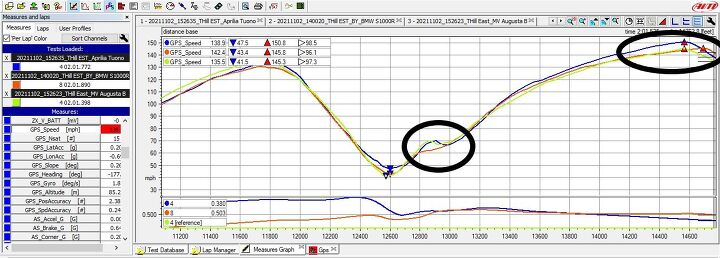
Turn 14 seems like an innocent right bend, but its apex is actually much later than it looks. Get there too early and you’ll be scrambling to adjust your line before Turn 15, killing your drive onto the start/finish straight. In fact, you’re well into T14 where the Street View image above is taken. The apex is roughly where the red car is (also note the ideal line for a car can be very different than a motorcycle). At the tight apex of T14 we’re braking from 137 mph down to 41.5 mph in Ken’s case. You can see the long deceleration zone in the left half of the graph below. Both Mark and I hit our slowest points a few feet later than Ken (shown by the orange triangles), but Mark slows to 43.4 mph while I’m about 4 mph faster at the same spot.

The difference is that both Ken and Mark reach their slow points and stay there for a relatively short time before accelerating. While my slowest point is at a higher speed than theirs, I’m staying there longer before accelerating, by which point Mark and Ken are well into their acceleration phase and have surpassed me.
Turn 15
Turn 15 is an open radius right turn leading onto the front straight. So, it’s important to get a good drive out of it. While all protagonists are accelerating out of T14 towards T15, using all of the pavement and the curbing, Mark checks up early, in what looks like a split second of coasting or neutral throttle, I assume to setup for T15. Both Ken and I keep accelerating, then let off the throttle for a second – approximately where the Street View image begins – to get direction and drive onto the front straight. This is shown in the circle in the T14 graph and the left circle in the graph below.
Start/Finish
Ultimately, I make my time back on Mark about 1/4 down the straight, before reaching my highest speed of 150.8 mph by approximately start/finish (right circle below). Ken hits 145.3 mph and Mark does 145.7 mph. Be sure to rotate the Street View image above to get a better idea just how long the front straight is.
And there it is. A similar lap of Thunderhill Raceway’s East Track by three different riders on three different bikes: Ken on the MV Agusta, Mark on the BMW, and me on the Aprilia. What did we learn? Well, Mark seemed to have tremendous confidence opening the BMW’s throttle and using its brake lever. Ken used his extensive track knowledge, and confidence in the MV chassis, to keep it steady and cool en route to the quickest time, while I relied on the Aprilia’s punch and tried to brake later than the others to make a lap time. Ultimately, our styles all brought us to the same place.
Could another bike have gone faster that day? Sure. But again, under these conditions, none of them did. The point here wasn’t so much to speculate how fast a bike could go, but to dissect how these three bikes and riders achieved the time they did.
Troy's been riding motorcycles and writing about them since 2006, getting his start at Rider Magazine. From there, he moved to Sport Rider Magazine before finally landing at Motorcycle.com in 2011. A lifelong gearhead who didn't fully immerse himself in motorcycles until his teenage years, Troy's interests have always been in technology, performance, and going fast. Naturally, racing was the perfect avenue to combine all three. Troy has been racing nearly as long as he's been riding and has competed at the AMA national level. He's also won multiple club races throughout the country, culminating in a Utah Sport Bike Association championship in 2011. He has been invited as a guest instructor for the Yamaha Champions Riding School, and when he's not out riding, he's either wrenching on bikes or watching MotoGP.
More by Troy Siahaan


Comments
Join the conversation
Great article, Troy! That's a lot of analysis to pull together. While there were obviously some clearly visible differences in riding style, it still illustrates the importance of getting into and out of the corner as quickly as possible.
Is it just me, or are track days the motorcycling equivalent of baseball fantasy camp?